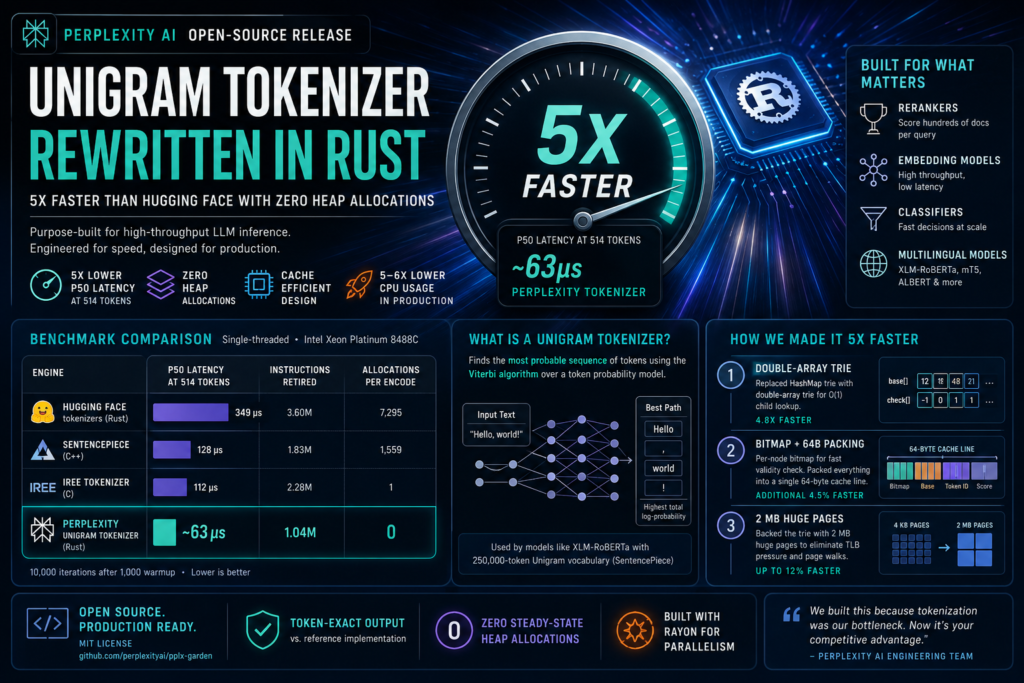
Perplexity AI has open-sourced a rewritten Unigram tokenizer in Rust that achieves roughly 5x lower p50 latency than the Hugging Face tokenizers crate — with zero steady-state heap allocations. If you run LLM inference pipelines with rerankers, classifiers, or embedding models, this release directly affects your end-to-end latency budget.
What Is a Unigram Tokenizer?
Definition: A Unigram tokenizer is a subword tokenization algorithm that segments text by finding the single most probable sequence of vocabulary tokens. Unlike Byte-Pair Encoding (BPE), which builds vocabulary greedily from the most frequent character pairs, the Unigram model treats segmentation as a probabilistic optimization problem.
How it works: Each token in the vocabulary carries a learned log-probability. The tokenizer then picks the segmentation whose token log-probabilities sum to the highest value — effectively the most-probable path through all possible ways of splitting the input. The algorithm that finds this path is the Viterbi algorithm, a dynamic programming method developed in 1967, originally for decoding convolutional codes.
The Unigram tokenizer was introduced by Taku Kudo in 2018 and is implemented in SentencePiece. It is the tokenization backbone for models like XLM-RoBERTa, which uses a 250,000-token Unigram vocabulary. Fine-tuned RoBERTa-family encoders are a common production choice for retrieval, ranking, and semantic similarity tasks — the exact workloads where Perplexity’s new implementation delivers its largest gains.
Why Tokenization Became an LLM Inference Bottleneck
GPU cost dominates LLM inference discussions: KV caches, attention kernels, expert routing. But this framing misses what happens with smaller, specialized models — and those models are where most production traffic actually runs.
A reranker, embedding model, or classifier can be two to three orders of magnitude smaller than a frontier transformer. On modern hardware, GPU compute for such a model often completes in single-digit milliseconds. But every input still passes through CPU-side tokenization before the GPU sees it. When a reranker is scoring hundreds of candidate documents per request, tokenization runs hundreds of times per query. The cumulative CPU cost becomes measurable — sometimes dominant — in end-to-end latency.
Perplexity’s engineering team observed this pattern in their own inference stack. Their reranker, built on XLM-RoBERTa with SentencePiece’s Unigram vocabulary, was spending a disproportionate share of request time on the CPU tokenization step. The GPU was fast; the tokenizer was the ceiling.
This is the class of problem the new open-source Unigram tokenizer was built to solve.
What Was Broken in the Hugging Face Implementation
The Hugging Face tokenizers crate is the default Rust tokenizer most teams reach for. It is well-maintained, supports many tokenization algorithms, and integrates cleanly with the broader Hugging Face ecosystem. But at production input lengths, it has three costly patterns in its inner loop.
The Three Bottlenecks, Explained
The Viterbi inner loop walks a vocabulary trie at each byte position of the input. On a 512-token input, this means hundreds of thousands of trie transitions. Each transition in the Hugging Face implementation triggers:
1. A heap allocation per match. The implementation calls String::from_utf8 for each candidate token during the trie walk, then looks it up in an AHashMap. At 514 tokens (512 plus BOS/EOS injection), this produces 7,295 allocations per encode. At 16,000 tokens, that number reaches 299,171 allocations. Each allocation is roughly 2 KB. When cumulative allocations overflow the per-core L2 cache, latency degrades sharply.
2. Pointer chasing at every trie node. The trie stores children in an AHashMap at each node. A single byte step requires a hash computation, two pointer dereferences, and a heap access — four dependent loads. Dependent loads cannot be pipelined; each must wait for the prior result. On a hot-path executing millions of such steps, this serialization is the dominant latency source.
3. L2 cache thrashing on longer inputs. The DP table and output buffers are freshly allocated on each call. At 128-token inputs, L2 miss rate sits around 8%. At 16,000-token inputs, it climbs to 50%. Every miss adds tens of nanoseconds; at this scale, those nanoseconds accumulate into milliseconds.
Comparison: Bottlenecks by Mechanism and Impact
| Bottleneck | Mechanism | Measured Impact |
|---|---|---|
| Allocation per match | String::from_utf8 + AHashMap lookup per trie match | 7,295 allocs at 514 tokens; 299,171 at 16K tokens |
| Pointer chase per byte | AHashMap at every trie node; 4 dependent loads per step | Dependent-load latency dominates the inner loop |
| L2 thrashing on long inputs | DP table and buffers freshly allocated each call | L2 miss rate: 8% at 128 tokens → 50% at 16K tokens |
The per-token allocation rate is constant regardless of input length — roughly 18 allocations and 2 KB per token. The problem compounds because long inputs push cumulative allocations past both L2 and L3 cache bounds.
How Perplexity Rebuilt the Unigram Tokenizer From Scratch
Perplexity’s team took a structured approach: first eliminate unnecessary work, then optimize the core data structure, then tune memory layout. Each step was benchmarked independently so the contribution of each change could be quantified.
Step 0 — Zero-Allocation Baseline
Before changing the trie, Perplexity isolated how much of the cost was pure allocation overhead. They made a zero-allocation port of the reference: same HashMap trie, but with a caller-owned scratch struct reused across calls and token IDs stored directly in trie nodes (removing the per-match string allocation and secondary hash-map lookup).
This baseline alone cut p50 latency from 326 µs to 155 µs at 514 tokens. Instructions retired dropped 2.4x. The HashMap pointer chase itself was now the remaining bottleneck — and that is what the next three optimizations address.
Optimization 1 — Double-Array Trie
The HashMap trie costs four dependent loads per byte step. Perplexity replaced it with a double-array trie, a structure that encodes the entire trie in two flat integer arrays — base and check — originally introduced by Aoe in 1989 and also used by SentencePiece and IREE.
A child lookup in a double-array trie is: compute next = base[node] + byte, then verify check[next] == node. That is two array reads, one integer addition, and one comparison. No hashing. No pointer chasing. For XLM-RoBERTa’s 250,000-token vocabulary, the whole trie fits in approximately 9 MB of contiguous memory. The hot working set per encode — the nodes actually visited during a single call — is on the order of 100 KB, which fits comfortably in L2 cache.
Unlike SentencePiece and IREE (which are general-purpose libraries with lattice bookkeeping and multi-stage pipelines), Perplexity inlined the trie directly in the Viterbi loop and dropped all that overhead.
Result: p50 at 514 tokens dropped from 155 µs (zero-allocation baseline) to 68 µs. Wall-clock fell 4.8x from the original Hugging Face reference.
Optimization 2 — Bitmap + 64-Byte Cache-Line Packing
The double-array trie still requires two dependent array loads per byte step: first the parent’s base offset, then the check array to confirm the transition is valid. Perplexity replaced the check array with a per-node bitmap — four 64-bit words (32 bytes) — that records which of the 256 possible byte values have valid child transitions.
A bitmap lookup compiles to a single bit test against one 64-bit word. The check array is only needed during trie construction and is dropped from the runtime layout entirely.
They also packed all four per-node fields — bitmap, base offset, token ID, and token score — into a single 64-byte cache line, matching the CPU cache line width exactly. One trie step now loads a single cache line that covers the validity check for the next byte, the child slot offset, and terminal token data at once.
The trade-off: trie size grows from ~9 MB to ~50 MB (780,000 nodes × 64 bytes). The hot working set per encode remains ~100 KB, so the expanded size does not hurt the inner loop.
Result: Additional 4.5% wall-clock reduction. L2 accesses at 514 tokens dropped from 4,600 to 1,800 per encode.
Optimization 3 — 2 MB Huge Pages for the Trie
At 50 MB, the trie spans roughly 12,000 virtual pages on a default Linux system using 4 KB pages. Intel Sapphire Rapids’ first-level data TLB holds 96 entries. Each Viterbi step touches a different trie node, so TLB misses accumulate and trigger page-table walks. Perplexity estimated roughly 9,000 cycles spent in page-table walks per 512-token encode — about 3% of the per-encode budget.
The fix: back the trie with 2 MB huge pages via mmap with the MAP_HUGETLB flag. The same 50 MB now spans just 25 pages — well within TLB capacity. In Perplexity’s production setup, 10,561 huge pages are reserved at boot; the trie uses 24 of them.
Result: 3–12% wall-clock reduction depending on input length. The largest gain appears at 4,098 tokens (−12.0%), where page-table traffic was actively competing with trie data for L2 bandwidth.
Final Benchmark Results: Perplexity vs. Every Major Tokenizer
All measurements are single-threaded, pinned to one core on an Intel Xeon Platinum 8488C, with 10,000 iterations after 1,000 warmup rounds.
At 514 Tokens (512 + BOS/EOS)
| Engine | p50 Latency | Instructions Retired | Allocations |
|---|---|---|---|
Hugging Face tokenizers (Rust) | 349 µs | 3.60M | 7,295 |
| SentencePiece (C++) | 128 µs | 1.83M | 1,559 |
| IREE tokenizer (C) | 112 µs | 2.28M | 1 |
| Perplexity (all 3 optimizations) | ~63 µs | 1.04M | 0 |
Across the full optimization sequence, instructions per encode fell from 3.66M to 1.04M — a 3.5x reduction. Wall-clock matches that ratio at short inputs and widens further at long inputs, where the Hugging Face reference’s per-token allocations overflow L2 and L3 cache.
One additional finding worth noting: off-the-shelf Rust wrapper crates around SentencePiece and IREE add 1.6–1.9x latency overhead compared to native C/C++ binaries. The sentencepiece Rust crate, for instance, allocates a fresh list of token pieces on each call. These wrappers can silently erase the performance advantage of the underlying native library.
In production at Perplexity, the new Unigram tokenizer reduced CPU utilization in their inference stack by 5–6x and shaved double-digit milliseconds off reranker latency.
What This Means for Engineers Building LLM Pipelines
Q: Does this matter if I’m not running a reranker? It depends on your workload. For large generative models where GPU compute dominates, tokenization overhead is typically negligible. For small encoder-only models (classifiers, embedding models, cross-encoders) processing high-throughput or large-batch requests, the Unigram tokenizer becomes a measurable latency contributor — and this implementation directly addresses that.
Q: What models use a Unigram tokenizer? The Unigram tokenization algorithm (implemented via SentencePiece) is used by XLM-RoBERTa, ALBERT, mT5, ByT5, and several multilingual models. If your model uses a SentencePiece vocabulary, this implementation is directly relevant.
Key Takeaways for Practitioners
- CPU tokenization is invisible in GPU profiling traces but real in end-to-end latency, especially for small encoder-only models under high batch load.
- Allocation overhead alone was responsible for more than half the Hugging Face reference’s cost — removing it (without changing the trie) cut p50 from 326 µs to 155 µs.
- The double-array trie is the single largest optimization: it brought p50 from 155 µs to 68 µs by replacing four dependent loads per byte step with two array reads and one comparison.
- Rust wrapper crates around SentencePiece or IREE can introduce 1.6–1.9x latency overhead versus native binaries, even when the underlying library is fast.
- Huge pages are a meaningful tuning lever for data structures larger than ~10 MB on modern server hardware, reducing TLB pressure by orders of magnitude.
- The new Unigram tokenizer produces token-exact output versus the reference — no accuracy trade-off.
- The code uses
rayonfor parallelism across cores in production.
How to Access Perplexity’s Open-Source Unigram Tokenizer
Perplexity released the implementation in their inference technology repository, pplx-garden, on GitHub at github.com/perplexityai/pplx-garden under the MIT license. The technical write-up is available at research.perplexity.ai/articles/improving-unigram-tokenizer-cpu-performance.
The release targets XLM-RoBERTa’s 250,000-token SentencePiece Unigram vocabulary, but the approach — double-array trie, bitmap packing, huge pages, zero-allocation Viterbi — is applicable to any Unigram vocabulary of comparable size.
Deploying the huge-page optimization requires setting vm.nr_hugepages at boot. Perplexity reserves 10,561 pages in production; the trie uses 24. The remaining configuration is standard Rust and requires no specialized tooling.
Conclusion
Perplexity’s open-source Unigram tokenizer is a precise, well-documented case study in performance engineering: eliminate allocations first, then fix the data structure, then tune memory layout. Each step is independently measured and the combined result — ~63 µs p50 at 514 tokens, zero steady-state heap allocations, 5–6x CPU utilization reduction in production — is a meaningful improvement over every existing open-source option.
For any team running encoder-only models at high throughput, this Unigram tokenizer implementation is worth serious evaluation. The underlying techniques (double-array trie, cache-line packing, huge pages) are also instructive for anyone optimizing CPU-bound components in inference pipelines more broadly.
The era of treating tokenization as a free operation is over for high-throughput AI stacks. Perplexity’s open-source contribution makes it substantially cheaper.