୨୦୨୬ ମସିହାର ତୃତୀୟ ତ୍ରୈମାସିକରେ ଉତ୍ତର ଆମେରିକାରେ ରୋବଟ୍ ଅର୍ଡର ୨୪.୮% ବୃଦ୍ଧି ପାଇଛି: A3 ରିପୋର୍ଟ
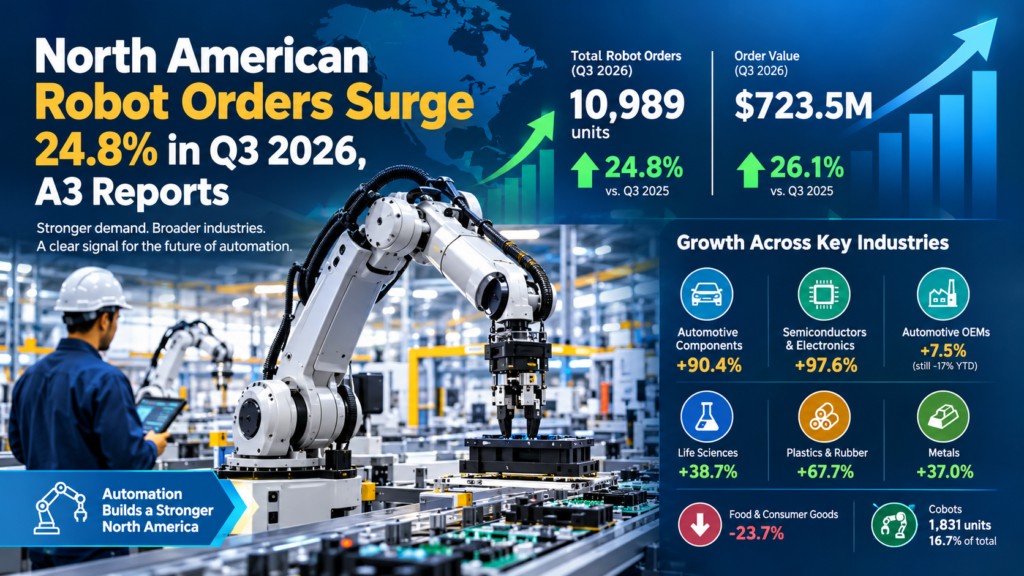
North American robot orders rose 24.8% in units in the third quarter of 2026, with companies ordering 10,989 robots valued at $723.5 million, according to the Association for Advancing Automation (A3). Order value grew even faster, up 26.1% from the third quarter of 2025, which makes Q3 the strongest quarter of the year so far.
Here is the part that matters more than the headline: this was not a one-industry story. Automotive suppliers nearly doubled their orders, semiconductor and electronics makers almost doubled theirs, and automotive OEMs, which weighed on the market for most of the year, finally returned to growth. This article breaks down the numbers, the industries behind them, and what they signal for the final quarter of 2026.
Published October 30, 2026. Figures come from the A3 robot orders report released on October 28, 2026.
Key Takeaways
- Headline numbers: North American robot orders reached 10,989 units worth $723.5 million, up 24.8% in units and 26.1% in value year over year.
- Strongest quarter of 2026: Q3 lifted orders for the first nine months to 28,984 robots worth about $1.89 billion, up 9.6% in units and 13.3% in value.
- Broad-based growth: Semiconductors and electronics (+97.6%), automotive components (+90.4%), plastics and rubber (+67.7%), life sciences (+38.7%) and metals (+37.0%) all posted large gains.
- Automotive OEMs turned positive: Orders from automakers rose 7.5% in Q3 but are still 17% below last year through September.
- Cobots accelerated: Collaborative robot orders grew about 56% to 1,831 units, or 16.7% of all robots ordered.
- One clear decline: Food and consumer goods orders fell 23.7%.
- Watch list: A3 flags higher input costs, trade uncertainty and the timing of large manufacturing projects.
What Did A3 Report About Q3 2026 Robot Orders?
A3 reported that North American robot orders hit their highest level of 2026 in the third quarter, driven by growth in nearly every major manufacturing segment it tracks. The numbers come from the association’s quarterly market data, which has become a closely watched barometer for factory investment across the region.
What are North American robot orders?
North American robot orders are the count and dollar value of industrial robots that companies in the region commit to buying during a given period, as measured and reported by A3. Orders are a forward-looking signal. They capture purchase commitments rather than robots already running on a factory floor, which is why analysts treat them as an early read on capital spending and automation appetite.
A3 breaks the data into industries such as automotive OEMs, automotive components, semiconductors and electronics, life sciences, plastics and rubber, metals, and food and consumer goods. It also tracks collaborative robots, or cobots, as a separate category.
How big was the third quarter?
North American robot orders totaled 10,989 robots valued at $723.5 million. Compared with Q3 2025, that is a 24.8% increase in units and a 26.1% increase in dollar value. Because value grew slightly faster than units, the average order was worth a little more than a year ago, which hints at larger systems or higher-spec equipment in the mix.
How Do Q3 2026 Numbers Compare With Earlier Quarters?
North American robot orders in Q3 2026 outpaced every earlier quarter of the year, and they also beat the same quarter in 2025 by a wide margin. The table below puts the key figures side by side.
| Period | Robots ordered | Order value | What stands out |
|---|---|---|---|
| Q3 2025 | 8,806 | $574 million | Baseline for the year-over-year comparison |
| Q2 2026 | 8,940 | $622 million | Modest growth as demand spread beyond automotive |
| Q3 2026 | 10,989 | $723.5 million | +24.8% units and +26.1% value vs. Q3 2025 |
| Jan–Sep 2026 | 28,984 | About $1.89 billion | +9.6% units and +13.3% value year over year |
By our own calculation from A3’s published figures, Q3 2026 was about 23% higher in units than Q2 2026 and about 16% higher in value. That sequential jump is notable because the year started slowly. A3 reported that first-quarter orders were essentially flat, with units down 0.1% and revenue down 6.4% from the first quarter of 2025, a decline that A3 attributed in large part to the size and timing of automotive programs.
Why the year-to-date picture still matters
The nine-month totals show that North American robot orders are growing, but at a more moderate pace than the Q3 headline suggests. Nine-month units are up 9.6% and value is up 13.3%. In other words, the third quarter did a lot of the heavy lifting. Investors, integrators and suppliers should avoid extrapolating a 24.8% quarterly gain into a full-year forecast, though the trend line is clearly pointing the right way.
Which Industries Drove North American Robot Orders Higher?
Automotive components and semiconductors and electronics led North American robot orders in the quarter, with both sectors close to doubling their order volumes. A3 described the broader mix of gainers as the most important part of the story. In the words of A3 Executive Vice President Alex Shikany, what stands out is “how broadly it was distributed across the market.”
| Industry | Change vs. Q3 2025 | Context |
|---|---|---|
| Semi & Electronics/Photonics | +97.6% units | Tied to U.S. chip manufacturing and AI-related electronics demand |
| Automotive Components | +90.4% | Continued strong supplier demand seen earlier in 2026 |
| Plastics & Rubber | +67.7% units | A rebound after a 35% drop in Q3 2025 |
| Life Sciences/Pharma/Biomed | +38.7% units | Domestic pharmaceutical manufacturing investment |
| Metals | +37.0% units | Solid gains in a core general-industry segment |
| Automotive OEM | +7.5% | First positive quarter after declines in the first half |
| All Other Industries | +0.5% units | Essentially flat |
| Food & Consumer Goods | −23.7% units | Follows a 105% surge in Q3 2025 |
What happened in automotive?
Automotive OEM orders returned to growth in Q3, rising 7.5% year over year, while automotive component orders climbed 90.4%. The split is the clearest example of how uneven the auto cycle has been. Component suppliers have been ordering aggressively, which A3 has noted is typical because suppliers often lag or lead OEM ordering cycles depending on program timing. OEMs, by contrast, cut orders in the first half of 2026.
Even with the Q3 rebound, OEM orders remain 17% below their year-earlier level through the first nine months. So the honest read is that automotive OEMs have stopped falling, not that they have fully recovered. Automotive component robot orders, meanwhile, are doing the work of keeping the overall auto category healthy.
Why are semiconductors and electronics surging?
Semiconductor and electronics robot orders jumped 97.6% in units, the biggest gain of any sector A3 listed. A3 linked the growth to continued investment in U.S. semiconductor manufacturing and to strong demand for electronics that support AI and other applications. Chip fabrication and electronics assembly are precision-heavy, cleanroom-friendly environments where robots are a natural fit, so new capacity tends to translate quickly into equipment orders.
What is behind the life sciences gains?
Life sciences, pharmaceuticals and biomedical manufacturers increased unit orders by 38.7%. A3 pointed to continued investment in domestic pharmaceutical manufacturing as one driver. This is also the segment where collaborative robots have the deepest penetration, a point we return to in the cobot section below.
Plastics, metals, food and consumer goods
Plastics and rubber orders rose 67.7% in units, a sharp turnaround from the 35% decline A3 recorded in the same quarter of 2025. Metals added 37.0%. Food and consumer goods was the lone major decliner at 23.7%. That decline should be read with context: the same segment had jumped 105% in Q3 2025, so the comparison base was unusually high. Still, A3’s data shows it as the one sector that moved against the tide this quarter.
Why Are Collaborative Robot Orders Climbing?
Collaborative robot orders rose about 56% in units in Q3 2026, reaching 1,831 robots valued at $63.8 million. Cobots accounted for 16.7% of all robot units ordered during the quarter. The table below compares the two most recent third quarters.
| Metric | Q3 2025 | Q3 2026 |
|---|---|---|
| Cobot units ordered | 1,174 | 1,831 |
| Cobot order value | $42 million | $63.8 million |
| Share of all robot units | 13.3% | 16.7% |
Through September, North American companies ordered 4,605 cobots valued at roughly $178 million. That works out to 15.9% of total robot units and 9.4% of total order value. The gap between unit share and value share reflects a basic fact about cobots: they are typically cheaper per unit than traditional industrial robots. By our calculation, the average cobot order in Q3 was worth roughly $34,800, versus roughly $65,800 for the average robot across all categories.
Where do cobots matter most?
Cobots are not spread evenly across industries. In the first nine months of 2026, they made up 43.8% of robot orders in life sciences, pharma and biomedical manufacturing and 36.9% in semiconductors, electronics and photonics. These are environments with smaller parts, frequent product changeovers and a premium on flexibility, which plays to the strengths of collaborative designs.
What does cobot growth signal?
Cobots now make up a growing slice of North American robot orders, and that rise suggests that automation is moving beyond big, fixed lines at large automakers and into more varied workflows. A3’s data has shown the same pattern for several quarters: demand is broadening across industries and applications. For smaller manufacturers, that matters, because cobots lower the capital and floor-space barriers to entry.
What Is Driving the Surge in Robot Orders?
Three forces stand out behind North American robot orders: stronger factory activity, targeted capital investment in strategic sectors, and ongoing pressure to automate. The first is the easiest to measure. A3 noted that the September ISM Manufacturing PMI registered 54.5, the ninth consecutive month of expansion, and that Federal Reserve data showed manufacturing output up 0.3% in September. When factories are busy and order books are growing, spending on automation tends to follow.
The second driver is sector-specific investment. A3 highlighted U.S. semiconductor manufacturing, AI-related electronics demand and domestic pharmaceutical production as areas where new capacity is being built. These projects are lumpy and often involve multiple robots per cell, which can swing quarterly numbers sharply.
The third is structural. A3’s earlier reports on 2025 attributed rising orders to companies making longer-term investments to address workforce challenges and reshoring costs. Nothing in the Q3 2026 data contradicts that framing, and the broader mix of industries buying robots supports it.
Is this a sign that automation is becoming a strategic priority?
The data is consistent with that interpretation, though orders alone cannot prove intent. What the numbers do show is that robot demand now comes from a wider set of buyers than it did even a year ago, and that several of the fastest-growing segments are tied to long-term national and corporate investment themes rather than a single product cycle.
What Are the Risks to the Outlook?
A3 named three risks to North American robot orders: higher input costs, trade uncertainty and the timing of large manufacturing projects. Each can change robot buying behavior quickly.
- Higher input costs squeeze margins and can delay discretionary equipment purchases, especially for smaller manufacturers.
- Trade uncertainty complicates sourcing decisions for both robots and the components that go into them, and it can slow investment decisions tied to new plants.
- Project timing can pull large orders forward or push them out, so one big program can swing a single quarter.
There are also data-specific caveats. Orders are not shipments or installations, so a strong quarter does not guarantee the same level of deployments in the near term. Automotive OEM orders are still well below last year on a nine-month basis. And the decline in food and consumer goods is a reminder that a rising tide does not lift every segment at the same time.
Even so, A3 concluded that the North American market enters the final quarter of 2026 with positive momentum.
What Should Manufacturers, Integrators and Suppliers Take Away?
The practical message from North American robot orders is that automation demand is diversifying, so the opportunity is no longer concentrated in a single sector. Here is how that plays out for different readers.
- Manufacturers: Expect competition for integrator capacity and lead times to tighten in fast-growing segments such as semiconductors, life sciences and metals. Planning projects earlier can help secure slots.
- System integrators: Cobot and general-industry demand is growing alongside traditional automotive work. Building expertise in flexible, smaller-footprint applications can broaden your customer base.
- Component and robot suppliers: Automotive component buyers and chip-related manufacturers are placing sizable orders. Tracking the shift away from automotive OEMs as the sole bellwether can improve forecasting.
- Investors and analysts: Treat Q3 as a strong data point rather than a trend on its own. Nine-month growth of 9.6% in units is healthy, and Q4 results will show whether the third quarter’s pace holds.
Frequently Asked Questions
How many robots were ordered in North America in Q3 2026?
Companies in North America ordered 10,989 robots valued at $723.5 million in the third quarter of 2026, according to A3. That was up 24.8% in units and 26.1% in value from Q3 2025.
Which industry grew the fastest in Q3 2026?
Semiconductors, electronics and photonics grew the fastest among North American robot orders, with units up 97.6%. Automotive components followed at +90.4%, and plastics and rubber rose 67.7%.
Did automotive OEM orders recover in Q3 2026?
Partly. Automotive OEM orders rose 7.5% in Q3 after declining in the first half, but they remain 17% below their year-earlier level through the first nine months of 2026.
Which sector declined in Q3 2026?
Food and consumer goods was the notable decliner, with orders down 23.7%. The sector had surged 105% in Q3 2025, which made for a tough comparison.
How many cobots were ordered in Q3 2026?
A3 reported 1,831 collaborative robots valued at $63.8 million, up about 56% in units from Q3 2025. They made up 16.7% of all robot units ordered in the quarter.
Do higher robot orders mean more robots are already installed?
Not necessarily. Orders measure purchase commitments, not completed installations. Delivery and deployment typically follow after the order is placed, so orders are best read as a leading indicator.
What is A3?
A3, the Association for Advancing Automation, is a trade association that promotes automation technologies and publishes quarterly North American robot order data. It says its members include more than 1,500 manufacturers, component suppliers, system integrators, end users, academic institutions, research groups and consulting firms.
The Bottom Line
North American robot orders climbed 24.8% in Q3 2026, and the details are as encouraging as the headline. Growth came from automotive suppliers, chip and electronics makers, life sciences, metals and plastics, while automotive OEMs finally moved back into positive territory. Cobots picked up speed, and manufacturing activity stayed in expansion for a ninth straight month.
The caveats are real. Automotive OEM orders are still down for the year, food and consumer goods pulled back, and input costs and trade uncertainty could shift plans. But with 28,984 robots ordered through September, the market has momentum going into Q4. The next A3 robot orders report will show whether the third quarter was a breakout or a high-water mark.
୨୦୨୬ ମସିହାର ତୃତୀୟ ତ୍ରୈମାସିକରେ ଉତ୍ତର ଆମେରିକାରେ ରୋବଟ୍ ଅର୍ଡର ୨୪.୮% ବୃଦ୍ଧି ପାଇଛି: A3 ରିପୋର୍ଟ
‘ଆସୋସିଏସନ୍ ଫର୍ ଆଡଭାନ୍ସିଂ ଅଟୋମେସନ୍’ (A3) ଅନୁଯାୟୀ, ୨୦୨୬ ମସିହାର ତୃତୀୟ ତ୍ରୈମାସିକରେ ଉତ୍ତର ଆମେରିକାରେ ରୋବଟ୍ ଅର୍ଡର ସଂଖ୍ୟା ୨୪.୮% ବୃଦ୍ଧି ପାଇଛି। ଏହି ସମୟରେ ବିଭିନ୍ନ କମ୍ପାନୀଗୁଡ଼ିକ ୭୨୩.୫ ନିୟୁତ ଡଲାର ମୂଲ୍ୟର ୧୦,୯୮୯ଟି ରୋବଟ୍ ପାଇଁ ଅର୍ଡର ଦେଇଛନ୍ତି। ଅର୍ଡରର ମୂଲ୍ୟ ଆହୁରି ଦ୍ରୁତ ଗତିରେ ବୃଦ୍ଧି ପାଇଛି; ୨୦୨୫ ମସିହାର ତୃତୀୟ ତ୍ରୈମାସିକ ତୁଳନାରେ ଏଥିରେ ୨୬.୧% ବୃଦ୍ଧି ଘଟିଛି। ଫଳସ୍ୱରୂପ, ୨୦୨୬ ବର୍ଷର ଏପର୍ଯ୍ୟନ୍ତ ଅତିକ୍ରମ କରିଥିବା ତ୍ରୈମାସିକଗୁଡ଼ିକ ମଧ୍ୟରେ ତୃତୀୟ ତ୍ରୈମାସିକ (Q3) ସବୁଠାରୁ ଶକ୍ତିଶାଳୀ ରହିଛି।
ଏଠାରେ ଏକ ଗୁରୁତ୍ୱପୂର୍ଣ୍ଣ ବିଷୟ ହେଉଛି ଯେ, ଏହି ଅଭିବୃଦ୍ଧି କେବଳ ଗୋଟିଏ ଶିଳ୍ପ କ୍ଷେତ୍ରରେ ସୀମିତ ନଥିଲା। ଅଟୋମୋବାଇଲ୍ (ଗାଡ଼ି ନିର୍ମାଣ) ସାମଗ୍ରୀ ଯୋଗାଣକାରୀଙ୍କ ଅର୍ଡର ପ୍ରାୟ ଦ୍ୱିଗୁଣିତ ହୋଇଛି, ସେମିକଣ୍ଡକ୍ଟର ଏବଂ ଇଲେକ୍ଟ୍ରୋନିକ୍ସ ନିର୍ମାତାଙ୍କ ଅର୍ଡର ମଧ୍ୟ ପ୍ରାୟ ଦ୍ୱିଗୁଣିତ ହୋଇଛି। ଏହା ବ୍ୟତୀତ, ଅଟୋମୋବାଇଲ୍ OEM (ମୂଳ ଉପକରଣ ନିର୍ମାତା) – ଯେଉଁମାନେ ବର୍ଷର ଅଧିକାଂଶ ସମୟ ବଜାର ଉପରେ ନକାରାତ୍ମକ ପ୍ରଭାବ ପକାଉଥିଲେ – ସେମାନଙ୍କ କ୍ଷେତ୍ରରେ ମଧ୍ୟ ପୁନର୍ବାର ଅଭିବୃଦ୍ଧି ଦେଖାଦେଇଛି। ଏହି ଲେଖାରେ ଆମେ ସଂଖ୍ୟାଗୁଡ଼ିକର ବିସ୍ତୃତ ବିଶ୍ଳେଷଣ କରିଛୁ, କେଉଁ ଶିଳ୍ପଗୁଡ଼ିକ ଏଥିରେ ସାମିଲ ଅଛନ୍ତି ତାହା ଦର୍ଶାଇଛୁ ଏବଂ ୨୦୨୬ର ଚୂଡ଼ାନ୍ତ ତ୍ରୈମାସିକ ପାଇଁ ଏହାର ସଙ୍କେତ କ’ଣ ହୋଇପାରେ, ସେ ବିଷୟରେ ଆଲୋଚନା କରିଛୁ।
ଏହା ୩୦ ଅକ୍ଟୋବର, ୨୦୨୬ରେ ପ୍ରକାଶିତ ହୋଇଛି। ଏହି ତଥ୍ୟଗୁଡ଼ିକ ୨୮ ଅକ୍ଟୋବର, ୨୦୨୬ରେ A3 ଦ୍ୱାରା ଜାରି କରାଯାଇଥିବା ରୋବଟ୍ ଅର୍ଡର ରିପୋର୍ଟରୁ ନିଆଯାଇଛି।
ମୁଖ୍ୟ ବିଷୟବସ୍ତୁ:
ମୁଖ୍ୟ ସଂଖ୍ୟା: ଉତ୍ତର ଆମେରିକାରେ ରୋବଟ୍ ଅର୍ଡର ୧୦,୯୮୯ ୟୁନିଟ୍ରେ ପହଞ୍ଚିଛି, ଯାହାର ମୂଲ୍ୟ ୭୨୩.୫ ନିୟୁତ ‘କୋବଟ୍’ (Cobots) କ୍ଷେତ୍ରରେ ତ୍ୱରାନ୍ୱିତ ଅଭିବୃଦ୍ଧି: ସହଯୋଗୀ ରୋବଟ୍ (Collaborative robots) ପାଇଁ ଅର୍ଡର ପ୍ରାୟ ୫୬% ବୃଦ୍ଧି ପାଇ ୧,୮୩୧ ୟୁନିଟ୍ରେ ପହଞ୍ଚିଛି, ଯାହା ମୋଟ ଅର୍ଡର ହୋଇଥିବା ରୋବଟ୍ଗୁଡ଼ିକର ୧୬.୭% ଅଟେ।
ଏକ ସ୍ପଷ୍ଟ ହ୍ରାସ: ଖାଦ୍ୟ ଏବଂ ଉପଭୋକ୍ତା ସାମଗ୍ରୀ କ୍ଷେତ୍ରରେ ଅର୍ଡର ୨୩.୭% ହ୍ରାସ ପାଇଛି।
ଧ୍ୟାନ ଦେବାକୁ ଥିବା ବିଷୟ: A3 (ଏ-ଥ୍ରୀ) ଉଚ୍ଚ ଉପାଦାନ ମୂଲ୍ୟ (input costs), ବାଣିଜ୍ୟିକ ଅନିଶ୍ଚିତତା ଏବଂ ବୃହତ ଉତ୍ପାଦନ ପ୍ରକଳ୍ପଗୁଡ଼ିକର କାର୍ଯ୍ୟକାରୀ ହେବା ସମୟସୀମା ଉପରେ ନଜର ରଖିବାକୁ ପରାମର୍ଶ ଦେଇଛି।
୨୦୨୬ ମସିହାର ତୃତୀୟ ତ୍ରୈମାସିକ (Q3) ପାଇଁ ରୋବଟ୍ ଅର୍ଡର ସମ୍ପର୍କରେ A3 କ’ଣ ରିପୋର୍ଟ ଦେଇଛି?
A3 ରିପୋର୍ଟ କରିଛି ଯେ ଉତ୍ତର ଆମେରିକାରେ ରୋବଟ୍ ଅର୍ଡର ୨୦୨୬ ମସିହାର ତୃତୀୟ ତ୍ରୈମାସିକରେ ସର୍ବୋଚ୍ଚ ସ୍ତରରେ ପହଞ୍ଚିଛି। ଏହାର ମୁଖ୍ୟ କାରଣ ହେଉଛି A3 ଦ୍ୱାରା ଅନୁଧ୍ୟାନ କରାଯାଉଥିବା ପ୍ରାୟ ସମସ୍ତ ପ୍ରମୁଖ ଉତ୍ପାଦନ କ୍ଷେତ୍ରରେ ହୋଇଥିବା ଅଭିବୃଦ୍ଧି। ଏହି ତଥ୍ୟ ସଂସ୍ଥାର ତ୍ରୈମାସିକ ବଜାର ରିପୋର୍ଟରୁ ମିଳିଛି, ଯାହା ଏହି ଅଞ୍ଚଳରେ କାରଖାନା ନିବେଶର ସ୍ଥିତି ଜାଣିବା ପାଇଁ ଏକ ଗୁରୁତ୍ୱପୂର୍ଣ୍ଣ ସୂଚକ ଭାବରେ ବିବେଚିତ ହୁଏ।
ଉତ୍ତର ଆମେରିକାରେ ରୋବଟ୍ ଅର୍ଡର କ’ଣ?
A3 ଅନୁଯାୟୀ, ଉତ୍ତର ଆମେରିକାରେ ରୋବଟ୍ ଅର୍ଡର କହିଲେ ଏକ ନିର୍ଦ୍ଦିଷ୍ଟ ସମୟ ମଧ୍ୟରେ ଏହି ଅଞ୍ଚଳର କମ୍ପାନୀଗୁଡ଼ିକ ଦ୍ୱାରା କିଣାଯିବାକୁ ଥିବା ଶିଳ୍ପ ରୋବଟ୍ଗୁଡ଼ିକର ସଂଖ୍ୟା ଏବଂ ସେଗୁଡ଼ିକର ମୂଲ୍ୟ (ଡଲାର୍ ମୂଲ୍ୟ) କୁ ବୁଝାଏ। ଏହି ଅର୍ଡରଗୁଡ଼ିକ ଭବିଷ୍ୟତର ସଙ୍କେତ ଦେଇଥାଏ। ଏଗୁଡ଼ିକ କାରଖାନାରେ ପୂର୍ବରୁ ଚାଲୁଥିବା ରୋବଟ୍କୁ ନୁହେଁ, ବରଂ କିଣାଯିବାକୁ ଥିବା ରୋବଟ୍ଗୁଡ଼ିକର ପ୍ରତିଶ୍ରୁତିକୁ ଦର୍ଶାଏ। ସେଥିପାଇଁ ବିଶ୍ଳେଷକମାନେ ଏହାକୁ ପୁଞ୍ଜି ନିବେଶ ଏବଂ ସ୍ୱୟଂଚାଳିତ ବ୍ୟବସ୍ଥା (automation) ଗ୍ରହଣ କରିବାର ଆଗୁଆ ସୂଚକ ଭାବରେ ଗ୍ରହଣ କରନ୍ତି।
A3 ଏହି ତଥ୍ୟକୁ ବିଭିନ୍ନ ଶିଳ୍ପ କ୍ଷେତ୍ର ଅନୁଯାୟୀ ବିଭାଜିତ କରି ୨୦୨୬ ମସିହାର ତୃତୀୟ ତ୍ରୈମାସିକରେ (Q3) ଉତ୍ତର ଆମେରିକାରେ ରୋବୋଟ୍ ପାଇଁ ଆସିଥିବା ଅର୍ଡର ସଂଖ୍ୟା ସେହି ବର୍ଷର ଅନ୍ୟ ସମସ୍ତ ତ୍ରୈମାସିକ ତୁଳନାରେ ଅଧିକ ଥିଲା। ଏହା ୨୦୨୫ ମସିହାର ସମାନ ତ୍ରୈମାସିକ ତୁଳନାରେ ମଧ୍ୟ ବହୁତ ଅଧିକ ରହିଥିଲା। ନିମ୍ନରେ ଦିଆଯାଇଥିବା ସାରଣୀରେ ମୁଖ୍ୟ ତଥ୍ୟଗୁଡ଼ିକୁ ଏକାଠି ଉପସ୍ଥାପନ କରାଯାଇଛି।
ଅବଧି | ଅର୍ଡର କରାଯାଇଥିବା ରୋବୋଟ୍ | ଅର୍ଡର ମୂଲ୍ୟ | ବିଶେଷତା
Q3 2025 | ୮,୮୦୬ | $୫୭୪ ନିୟୁତ | ବାର୍ଷିକ ତୁଳନା ପାଇଁ ଆଧାର (ବେସ୍ଲାଇନ୍)
Q2 2026 | ୮,୯୪୦ | $୬୨୨ ନିୟୁତ | ଅଟୋମୋବାଇଲ୍ (ଗାଡ଼ି ନିର୍ମାଣ) କ୍ଷେତ୍ର ବ୍ୟତୀତ ଅନ୍ୟ କ୍ଷେତ୍ରରେ ଚାହିଦା ବଢ଼ିବା ଯୋଗୁଁ ସାମାନ୍ୟ ଅଭିବୃଦ୍ଧି
Q3 2026 | ୧୦,୯୮୯ | $୭୨୩.୫ ନିୟୁତ | Q3 2025 ତୁଳନାରେ ସଂଖ୍ୟାରେ +୨୪.୮% ଏବଂ ମୂଲ୍ୟରେ +୨୬.୧% ବୃଦ୍ଧି
ଜାନୁଆରୀ–ସେପ୍ଟେମ୍ବର ୨୦୨୬ | ୨୮,୯୮୪ | ପ୍ରାୟ $୧.୮୯ ବିଲିୟନ | ଗତ ବର୍ଷ ତୁଳନାରେ ସଂଖ୍ୟାରେ +୯.୬% ଏବଂ ମୂଲ୍ୟରେ +୧୩.୩% ବୃଦ୍ଧି
A3 (Association for Advancing Automation) ଦ୍ୱାରା ପ୍ରକାଶିତ ତଥ୍ୟ ଅନୁଯାୟୀ ଆମର ଗଣନା ଅନୁସାରେ, ୨୦୨୬ ମସିହାର ତୃତୀୟ ତ୍ରୈମାସିକରେ (Q3 2026) ରୋବୋଟ୍ ସଂଖ୍ୟା ଦ୍ୱିତୀୟ ତ୍ରୈମାସିକ (Q2 2026) ତୁଳନାରେ ପ୍ରାୟ ୨୩% ଅଧିକ ଥିଲା ଏବଂ ମୂଲ୍ୟ ଦୃଷ୍ଟିରୁ ପ୍ରାୟ ୧୬% ଅଧିକ ଥିଲା। ଏହି କ୍ରମାଗତ ବୃଦ୍ଧି ଉଲ୍ଲେଖନୀୟ, କାରଣ ବର୍ଷର ଆରମ୍ଭ ଧୀମା ଥିଲା। A3 ରିପୋର୍ଟ ଅନୁଯାୟୀ, ପ୍ରଥମ ତ୍ରୈମାସିକରେ ଅର୍ଡର ସ୍ଥିତି ପ୍ରାୟ ସ୍ଥିର ଥିଲା; ୨୦୨୫ ମସିହାର ପ୍ରଥମ ତ୍ରୈମାସିକ ତୁଳନାରେ ରୋବୋଟ୍ ସଂଖ୍ୟା ୦.୧% ଏବଂ ରାଜସ୍ୱ ୬.୪% ହ୍ରାସ ପାଇଥିଲା। A3 ଏହି ହ୍ରାସ ପାଇଁ ମୁଖ୍ୟତଃ ଅଟୋମୋବାଇଲ୍ କାର୍ଯ୍ୟକ୍ରମଗୁଡ଼ିକର ଆକାର ଏବଂ ସମୟସୀମାକୁ ଦାୟୀ କରିଛି।
ବର୍ଷ ଆରମ୍ଭରୁ ବର୍ତ୍ତମାନ ପର୍ଯ୍ୟନ୍ତ (Year-to-date) ତଥ୍ୟ କାହିଁକି ଗୁରୁତ୍ୱପୂର୍ଣ୍ଣ?
ନଅ ମାସର ମୋଟ ତଥ୍ୟ ଦର୍ଶାଉଛି ଯେ ଉତ୍ତର ଆମେରିକାରେ ରୋବୋଟ୍ ଅର୍ଡର ବୃଦ୍ଧି ପ
ଏହି ତ୍ରୈମାସିକରେ ଉତ୍ତର ଆମେରିକୀୟ ରୋବୋଟ୍ ଅର୍ଡରକୁ ମୋଟରଗାଡ଼ି ଉପାଦାନ ଏବଂ ଅର୍ଦ୍ଧପରିବାହୀ ଏବଂ ଇଲେକ୍ଟ୍ରୋନିକ୍ସ ନେତୃତ୍ୱ ନେଇଥିଲେ, ଉଭୟ କ୍ଷେତ୍ର ସେମାନଙ୍କର ଅର୍ଡର ପରିମାଣକୁ ଦ୍ୱିଗୁଣିତ କରିବାକୁ ପାଖାପାଖି ପହଞ୍ଚିଥିଲେ। A3 ବର୍ଣ୍ଣନା କରିଛି ଏହି ଘଟଣାକ୍ରମର ସବୁଠାରୁ ଗୁରୁତ୍ୱପୂର୍ଣ୍ଣ ଦିଗ ହେଉଛି, ଲାଭ ପାଇଥିବା କ୍ଷେତ୍ରଗୁଡ଼ିକର ବ୍ୟାପକ ପରିସର। A3 ର କାର୍ଯ୍ୟନିର୍ବାହୀ ଉପ-ସଭାପତି (Executive Vice President) ଆଲେକ୍ସ ଶିକାନିଙ୍କ ଶବ୍ଦରେ କହିଲେ, ଏଥିରେ ଯେଉଁ ବିଷୟଟି ସବୁଠାରୁ ଉଲ୍ଲେଖନୀୟ, ତାହା ହେଲା “ବଜାରର ବିଭିନ୍ନ କ୍ଷେତ୍ରରେ ଏହାର ବ୍ୟାପକ ବିସ୍ତାର।”
ଶିଳ୍ପ Q3 2025 ତୁଳନାରେ ପରିବର୍ତ୍ତନ ପୃଷ୍ଠଭୂମି ସେମିକଣ୍ଡକ୍ଟର ଓ ଇଲେକ୍ଟ୍ରୋନିକ୍ସ/ଫୋଟୋନିକ୍ସ +୯୭.୬% ୟୁନିଟ୍ ଯୁକ୍ତରାଷ୍ଟ୍ର ଆମେରିକାରେ ଚିପ୍ ଉତ୍ପାଦନ ଏବଂ AI (କୃତ୍ରିମ ବୁଦ୍ଧିମତ୍ତା) ସମ୍ବନ୍ଧୀୟ ଇଲେକ୍ଟ୍ରୋନିକ୍ସ ଚାହିଦା ସହ ଜଡ଼ିତ
ଅଟୋମୋବାଇଲ୍ ଯନ୍ତ୍ରାଂଶ (Components) +୯୦.୪% ୨୦୨୬ ମସିହାର ପ୍ରାରମ୍ଭିକ ପର୍ଯ୍ୟାୟ ପରି ଏଠାରେ ମଧ୍ୟ ଯୋଗାଣକାରୀଙ୍କ ପକ୍ଷରୁ ଦୃଢ଼ ଚାହିଦା ଜାରି ରହିଛି ପ୍ଲାଷ୍ଟିକ୍ ଓ ରବର +୬୭.୭% ୟୁନିଟ୍ Q3 2025 ରେ ୩୫% ହ୍ରାସ ପାଇବା ପରେ ଏବେ ପୁନର୍ବାର ବୃଦ୍ଧି ଘଟିଛି ଜୀବନ ବିଜ୍ଞାନ/ଔଷଧ/ବାୟୋମେଡ୍ +୩୮.୭% ୟୁନିଟ୍ ଦେଶୀୟ ଔଷଧ ଉତ୍ପାଦନ କ୍ଷେତ୍ରରେ ନିବେଶ ଧାତୁ (Metals) +୩୭.୦% ୟୁନିଟ୍ ମୁଖ୍ୟ ଶିଳ୍ପ କ୍ଷେତ୍ରରେ ଉଲ୍ଲେଖନୀୟ ଅଭିବୃଦ୍ଧି
ଅଟୋମୋବାଇଲ୍ OEM +୭.୫% ବର୍ଷର ପ୍ରଥମାର୍ଦ୍ଧରେ ହ୍ରାସ ପାଇବା ପରେ, ଏହା ପ୍ରଥମ ସକାରାତ୍ମକ ତ୍ରୈମାସିକ ଅଟେ
ଅନ୍ୟାନ୍ୟ ଶିଳ୍ପ +୦.୫% ୟୁନିଟ୍ ମୋଟାମୋଟି ଭାବେ ସ୍ଥିର ରହିଛି
ଖାଦ୍ୟ ଓ ଉପଭୋକ୍ତା ସାମଗ୍ରୀ −୨୩.୭% ୟୁନିଟ୍ Q3 2025 ରେ ୧୦୫% ବୃଦ୍ଧି ପାଇବା ପରେ ଏବେ ହ୍ରାସ ଘଟିଛି
ଅଟୋମୋବାଇଲ୍ କ୍ଷେତ୍ରରେ କ’ଣ ଘଟିଲା?
ତୃତୀୟ ତ୍ରୈମାସିକରେ (Q3) ଅଟୋମୋବାଇଲ୍ OEM (ମୂଳ ଉପକରଣ ନିର୍ମାତା) ଅର୍ଡରଗୁଡ଼ିକ ପୁନର୍ବାର ବୃଦ୍ଧି ପାଇଛି, ଯାହା ଗତ ବର୍ଷ ତୁଳନାରେ ୭.୫% ଅଧିକ। ସେହିପରି, ଅଟୋମୋବାଇଲ୍ ଯନ୍ତ୍ରାଂଶ (components) ପାଇଁ ଅର୍ଡର ୯୦.୪% ବୃଦ୍ଧି ପାଇଛି। ଏହି ପାର୍ଥକ୍ୟରୁ ସ୍ପଷ୍ଟ ଜଣାପଡ଼େ ଯେ ଅଟୋମୋବାଇଲ୍ କ୍ଷେତ୍ରର ଚକ୍ର (auto cycle) କେତେ ଅସମାନ ରହିଛି। ଯନ୍ତ୍ରାଂଶ ଯ A3 ଏହି ଅଭିବୃଦ୍ଧି ପଛରେ ଆମେରିକାର ସେମିକଣ୍ଡକ୍ଟର ଉତ୍ପାଦନ କ୍ଷେତ୍ରରେ ନିରନ୍ତର ନିବେଶ ଏବଂ AI (କୃତ୍ରିମ ବୁଦ୍ଧିମତ୍ତା) ତଥା ଅନ୍ୟାନ୍ୟ ପ୍ରୟୋଗଗୁଡ଼ିକ ପାଇଁ ଆବଶ୍ୟକ ଇଲେକ୍ଟ୍ରୋନିକ୍ସ ସାମଗ୍ରୀର ପ୍ରବଳ ଚାହିଦାକୁ ମୁଖ୍ୟ କାରଣ ଭାବରେ ଦର୍ଶାଇଛି। ଚିପ୍ ନିର୍ମାଣ ଏବଂ ଇଲେକ୍ଟ୍ରୋନିକ୍ସ ଆସେମ୍ବଲି (ଯନ୍ତ୍ରାଂଶ ଯୋଡ଼ିବା) କାର୍ଯ୍ୟ ଅତ୍ୟନ୍ତ ସୂକ୍ଷ୍ମ ଏବଂ ନିର୍ଦ୍ଦିଷ୍ଟ ପରିବେଶ (cleanroom) ଆବଶ୍ୟକ କରେ, ଯେଉଁଠାରେ ରୋବଟ୍ଗୁଡ଼ିକ ବେଶ୍ ଉପଯୋଗୀ ହୋଇଥାଏ। ତେଣୁ, ଯେତେବେଳେ ଉତ୍ପାଦନ କ୍ଷମତା ବୃଦ୍ଧି ପାଏ, ସେତେବେଳେ ତୁରନ୍ତ ନୂତନ ଯନ୍ତ୍ରପାତି ପାଇଁ ଅର୍ଡର ମଧ୍ୟ ଆସିଥାଏ।
ଜୀବନ ବିଜ୍ଞାନ (Life Sciences) କ୍ଷେତ୍ରରେ ଅଗ୍ରଗତିର କାରଣ କ’ଣ?
ଜୀବନ ବିଜ୍ଞାନ, ଔଷଧ ନିର୍ମାଣ (ଫାର୍ମାସ୍ୟୁଟିକାଲ୍) ଏବଂ ବାୟୋମେଡିକାଲ୍ ଉତ୍ପାଦନକାରୀ କମ୍ପାନୀଗୁଡ଼ିକ ସେମାନଙ୍କ ଅର୍ଡର ସଂଖ୍ୟାରେ ୩୮.୭% ବୃଦ୍ଧି କରିଛନ୍ତି। A3 ଅନୁଯାୟୀ, ଦେଶ ମଧ୍ୟରେ ଔଷଧ ଉତ୍ପାଦନ କ୍ଷେତ୍ରରେ କ୍ରମାଗତ ନିବେଶ ଏହାର ଏକ ମୁଖ୍ୟ କାରଣ। ଏହି କ୍ଷେତ୍ରରେ ହିଁ ‘ସହଯୋଗୀ ରୋବଟ୍’ (collaborative robots ବା ‘cobots’) ର ବ୍ୟବହାର ସବୁଠାରୁ ଅଧିକ ରହିଛି; ଏ ବିଷୟରେ ଆମେ ନିମ୍ନରେ ‘କୋବଟ୍’ (cobot) ବିଭାଗରେ ଅଧିକ ଆଲୋଚନା କରିବା।
ପ୍ଲାଷ୍ଟିକ୍, ଧାତୁ, ଖାଦ୍ୟ ଏବଂ ଉପଭୋକ୍ତା ସାମଗ୍ରୀ ପ୍ଲାଷ୍ଟିକ୍ ଏବଂ ରବର କ୍ଷେତ୍ରରେ ଅର୍ଡର ସଂଖ୍ୟା ୬୭.୭% ବୃଦ୍ଧି ପାଇଛି। ଉଲ୍ଲେଖନୀୟ ଯେ, ୨୦୨୫ ମସିହାର ସମାନ ତ୍ରୈମାସିକରେ A3 ଏହି କ୍ଷେତ୍ରରେ ୩୫% ହ୍ରାସ ରେକର୍ଡ କରିଥିଲା, ଯାହା ତୁଳନାରେ ଏଥର ଏକ ବଡ଼ ସକାରାତ୍ମକ ପରିବର୍ତ୍ତନ ଦେଖାଦେଇଛି। ଧାତୁ ଉତ୍ପାଦନ କ୍ଷେତ୍ରରେ ୩୭.୦% ବୃଦ୍ଧି ଘଟିଛି। ଅନ୍ୟପକ୍ଷରେ, ଖାଦ୍ୟ ଏବଂ ଉପଭୋକ୍ତା ସାମଗ୍ରୀ କ୍ଷେତ୍ରରେ ୨୩.୭% ହ୍ରାସ ଘଟିଛି, ଯାହା ଏହି ଅବଧି ମଧ୍ୟରେ ଏକମାତ୍ର ପ୍ରମୁଖ ହ୍ରାସ ଥିଲା। ତେବେ ଏହି ହ୍ରାସକୁ ଏକ ନିର୍ଦ୍ଦିଷ୍ଟ ପରିପ୍ରେକ୍ଷୀରେ ଦେଖିବା ଆବଶ୍ୟକ: ୨୦୨୫ ମସିହାର ତୃତୀୟ ତ୍ରୈମାସିକରେ ଏହି କ୍ଷେତ୍ରରେ ୧୦୫% ବୃ ଏହା ମୋଟ ରୋବଟ୍ ସଂଖ୍ୟାର ୧୫.୯% ଏବଂ ମୋଟ ଅର୍ଡର ମୂଲ୍ୟର ୯.୪% ଅଟେ।
ରୋବଟ୍ ସଂଖ୍ୟା ଏବଂ ମୂଲ୍ୟ ମଧ୍ୟରେ ଥିବା ଏହି ପାର୍ଥକ୍ୟ ‘କୋବଟ୍’ (cobots – ସହଯୋଗୀ ରୋବଟ୍) ବିଷୟରେ ଏକ ମୌଳିକ ତଥ୍ୟକୁ ଦର୍ଶାଏ: ପାରମ୍ପାରିକ ଶିଳ୍ପ ରୋବଟ୍ ତୁଳନାରେ କୋବଟ୍ଗୁଡ଼ିକ ସାଧାରଣତଃ ଶସ୍ତା ହୋଇଥାଏ। ଆମର ଗଣନା ଅନୁଯାୟୀ, ତୃତୀୟ ତ୍ରୈମାସିକରେ (Q3) ଏକ ହାରାହାରି କୋବଟ୍ ଅର୍ଡରର ମୂଲ୍ୟ ପ୍ରାୟ ୩୪,୮୦୦ ଡଲାର ଥିଲା, ଯେତେବେଳେ କି ସମସ୍ତ ବର୍ଗର ରୋବଟ୍ ପାଇଁ ହାରାହାରି ମୂଲ୍ୟ ପ୍ରାୟ ୬୫,୮୦୦ ଡଲାର ଥିଲା।
କୋବଟ୍ଗୁଡ଼ିକ କେଉଁ କ୍ଷେତ୍ରରେ ସବୁଠାରୁ ଅଧିକ ଗୁରୁତ୍ୱପୂର୍ଣ୍ଣ?
ବିଭିନ୍ନ ଶିଳ୍ପ କ୍ଷେତ୍ରରେ କୋବଟ୍ଗୁଡ଼ିକ ସମାନ ଭାବରେ ବ୍ୟବହୃତ ହୁଅନ୍ତି ନାହିଁ। ୨୦୨୬ ମସିହାର ପ୍ରଥମ ନଅ ମାସ ମଧ୍ୟରେ, ଜୀବନ ବିଜ୍ଞାନ (life sciences), ଔଷଧ ନିର୍ମାଣ (pharma) ଏବଂ ବାୟୋମେଡିକାଲ୍ ଉତ୍ପାଦନ କ୍ଷେତ୍ରରେ ମୋଟ ରୋବଟ୍ ଅର୍ଡରର ୪୩.୮% କୋବଟ୍ ଥିଲା। ସେହିପରି ସେମିକଣ୍ଡକ୍ଟର, ଇଲେକ୍ଟ୍ରୋନିକ୍ସ ଏବଂ ଫୋଟୋନିକ୍ସ କ୍ଷେତ୍ରରେ ଏହାର ଅଂଶ ୩୬.୯% ଥିଲା। ଏହି କ୍ଷେତ୍ରଗୁଡ଼ିକରେ ଛୋଟ ଛୋଟ ଯନ୍ତ୍ରାଂଶ ବ୍ୟବହୃତ ହୁଏ, ଉତ୍ପାଦ ବାରମ୍ବାର ପରିବର୍ତ୍ତନ କରିବାକୁ ପଡ଼େ ଏବଂ ନମନୀୟତା (flexibility) ଉପରେ ଅଧିକ ଗୁରୁତ୍ୱ ଦିଆଯାଏ; ଯାହା କୋବଟ୍ର କାର୍ଯ୍ୟଦକ୍ଷତା ପାଇଁ ଅନୁକୂଳ ଅଟେ।
କୋବଟ୍ର ଏହି ଅଭିବୃଦ୍ଧି କ’ଣ ସୂଚିତ କରେ?
ଉତ୍ତର ଆମେରିକାରେ ରୋବଟ୍ ଅର୍ଡର ମଧ୍ୟରେ କୋବଟ୍ର ଅଂଶ କ୍ରମାଗତ ଭାବେ ବୃଦ୍ଧି ପାଉଛି। ଏହି ବୃଦ୍ଧି ସୂଚିତ କରେ ଯେ, ସ୍ୱୟଂଚାଳିତ ବ୍ୟବସ୍ଥା (automation) କେବଳ ବଡ଼ ଗାଡ଼ି ନିର୍ମାଣ କାରଖାନାର ସ୍ଥାୟୀ ଉତ୍ପାଦନ ଧାରା (fixed lines) ମଧ୍ୟରେ ସୀମିତ ନ ରହି, ବର୍ତ୍ତମାନ ବିଭିନ୍ନ ପ୍ରକାରର କାର୍ଯ୍ୟ ପ୍ରକ୍ରିୟାକୁ ବ୍ୟାପିବାରେ ଲାଗିଛି। A3 ର ତଥ୍ୟ ଅନୁଯାୟୀ, ଗତ କିଛି ତ୍ରୈମାସିକ ଧରି ଏହି ଧାରା ଦେଖିବାକୁ ମିଳୁଛି: ବିଭିନ୍ନ ଶିଳ୍ପ ଏବଂ କାର୍ଯ୍ୟକ୍ଷେତ୍ରରେ କୋବଟ୍ର ଚାହିଦା ବୃଦ୍ଧି ପାଉଛି। ଛୋଟ ଉତ୍ପାଦନକାରୀଙ୍କ SM ମାନୁଫାକ୍ଚରିଂ PMI (ଉତ୍ପାଦନ କ୍ଷେତ୍ରର କ୍ରୟ ପରିଚାଳକ ସୂଚକାଙ୍କ) ୫୪.୫ ରହିଛି, ଯାହା କ୍ରମାଗତ ନବମ ମାସ ପାଇଁ ଏହି କ୍ଷେତ୍ରର ସମ୍ପ୍ରସାରଣକୁ ସୂଚିତ କରୁଛି। ଏହା ବ୍ୟତୀତ, ଫେଡେରାଲ୍ ରିଜର୍ଭର ତଥ୍ୟ ଅନୁଯାୟୀ ସେପ୍ଟେମ୍ବର ମାସରେ ଉତ୍ପାଦନ କ୍ଷେତ୍ରର ଆଉଟପୁଟ୍ (ଉତ୍ପାଦନ ପରିମାଣ) ୦.୩% ବୃଦ୍ଧି ପାଇଛି। ଯେତେବେଳେ କାରଖାନାଗୁଡ଼ିକ ବ୍ୟସ୍ତ ରୁହନ୍ତି ଏବଂ ଅର୍ଡର ସଂଖ୍ୟା ବୃଦ୍ଧି ପାଏ, ସେତେବେଳେ ସ୍ୱୟଂଚାଳିତ ବ୍ୟବସ୍ଥା (automation) ଉପରେ ନିବେଶ ମଧ୍ୟ ବୃଦ୍ଧି ପାଇଥାଏ।
ଦ୍ୱିତୀୟ କାରଣଟି ହେଉଛି ନିର୍ଦ୍ଦିଷ୍ଟ କ୍ଷେତ୍ରଭିତ୍ତିକ ନିବେଶ। A3 (ଏ-ଥ୍ରୀ) ଅନୁଯାୟୀ, ଆମେରିକାରେ ସେମିକଣ୍ଡକ୍ଟର ଉତ୍ପାଦନ, AI (କୃତ୍ରିମ ବୁଦ୍ଧିମତ୍ତା) ସମ୍ବନ୍ଧୀୟ ଇଲେକ୍ଟ୍ରୋନିକ୍ସ ଚାହିଦା ଏବଂ ଘରୋଇ ଔଷଧ ଉତ୍ପାଦନ କ୍ଷେତ୍ରରେ ନୂତନ କ୍ଷମତା ବିକାଶ କରାଯାଉଛି। ଏହି ପ୍ରକଳ୍ପଗୁଡ଼ିକ ବହୁତ ବଡ଼ ଆକାରର ହୋଇଥାଏ ଏବଂ ଏଥିରେ ପ୍ରାୟତଃ ଗୋଟିଏ ୟୁନିଟ୍ (cell) ମଧ୍ୟରେ ଏକାଧିକ ରୋବଟ୍ ବ୍ୟବହାର କରାଯାଏ, ଯାହା ଫଳରେ ତ୍ରୈମାସିକ ତଥ୍ୟରେ ବଡ଼ ଧରଣର ପରିବର୍ତ୍ତନ ଦେଖାଦେଇପାରେ।
ତୃତୀୟ କାରଣଟି ହେଉଛି ଗଠନଗତ (structural)। ୨୦୨୫ ବର୍ଷ ପାଇଁ A3 ର ପୂର୍ବ ରିପୋର୍ଟଗୁଡ଼ିକରେ କୁହାଯାଇଥିଲା ଯେ, କମ୍ପାନୀଗୁଡ଼ିକ କର୍ମଚାରୀ ସମ୍ବନ୍ଧୀୟ ଆହ୍ୱାନ ଏବଂ ଉତ୍ପାଦନ କେନ୍ଦ୍ରକୁ ସ୍ୱଦେଶକୁ ଫେରାଇ ଆଣିବା (reshoring) ସହ ଜଡ଼ିତ ଖର୍ଚ୍ଚର ମୁକାବିଲା କରିବା ପାଇଁ ଦୀର୍ଘକାଳୀନ ନିବେଶ କରୁଛନ୍ତି, ଯାହା ଫଳରେ ଅର୍ଡର ସଂଖ୍ୟା ବୃଦ୍ଧି ପାଉଛି। ୨୦୨୬ର ତୃତୀୟ ତ୍ରୈମାସିକ (Q3) ତଥ୍ୟରେ ଏହି ଧାରଣାକୁ ଖଣ୍ଡନ କରୁଥିବା କୌଣସି ସୂଚନା ନାହିଁ; ବରଂ, ବିଭିନ୍ନ ପ୍ରକାରର ଶିଳ୍ପ ସଂସ୍ଥାଗୁଡ଼ିକ ରୋବଟ୍ କିଣୁଥିବା ଘଟଣା ଏହି ଧାରଣାକୁ ସମର୍ଥନ କରୁଛି।
ଏହା କ’ଣ ସୂଚାଉଛି ଯେ ସ୍ୱୟଂଚାଳିତ ବ୍ୟବସ୍ଥା (automation) ଏକ ରଣନୀତିକ ପ୍ରାଥମିକତାରେ ପରିଣତ ହେଉଛି?
ଉପଲବ୍ଧ ତଥ୍ୟ ଏହି ବ୍ୟାଖ୍ୟା ସହିତ ସମାନ, ଯଦିଓ କେବଳ ଅର୍ଡର ସଂଖ୍ୟାରୁ କମ୍ପାନୀଗୁଡ଼ିକର ପ୍ରକୃ ଖାଦ୍ୟ ଏବଂ ଉପଭୋକ୍ତା ସାମଗ୍ରୀ କ୍ଷେତ୍ରରେ ହ୍ରାସ ଏକ କଥା ମନେ ପକାଇ ଦିଏ ଯେ, ଏକ ସାଧାରଣ ଉନ୍ନତି ଲହରୀ ସମସ୍ତ କ୍ଷେତ୍ରକୁ ଏକ ସମୟରେ ଉପରକୁ ଉଠାଇ ପାରେ ନାହିଁ।
ତଥାପି, A3 (ଏ-ଥ୍ରୀ) ର ନିଷ୍କର୍ଷ ଅନୁଯାୟୀ, ଉତ୍ତର ଆମେରିକୀୟ ବଜାର ୨୦୨୬ ମସିହାର ଶେଷ ତ୍ରୈମାସିକରେ ଏକ ସକାରାତ୍ମକ ଗତିଶୀଳତା ସହ ପ୍ରବେଶ କରୁଛି।
ଉତ୍ପାଦନକାରୀ, ସିଷ୍ଟମ ଇଣ୍ଟିଗ୍ରେଟର ଏବଂ ଯୋଗାଣକାରୀମାନେ ଏଥିରୁ କ’ଣ ଶିଖିବା ଉଚିତ୍?
ଉତ୍ତର ଆମେରିକାରେ ରୋବଟ୍ ଅର୍ଡର ସମ୍ବନ୍ଧୀୟ ବାସ୍ତବ ସନ୍ଦେଶ ହେଉଛି ଯେ, ସ୍ୱୟଂଚାଳିତ ବ୍ୟବସ୍ଥା (automation) ପାଇଁ ଚାହିଦା ବିଭିନ୍ନ କ୍ଷେତ୍ରରେ ବ୍ୟାପୁଛି; ତେଣୁ ସୁଯୋଗ କେବଳ ଗୋଟିଏ କ୍ଷେତ୍ରରେ ସୀମିତ ହୋଇ ରହିନାହିଁ। ବିଭିନ୍ନ ବର୍ଗର ପାଠକଙ୍କ ପାଇଁ ଏହାର ଅର୍ଥ କ’ଣ, ତାହା ନିମ୍ନରେ ଦିଆଗଲା।
ଉତ୍ପାଦନକାରୀ: ସେମିକଣ୍ଡକ୍ଟର, ଜୀବନ ବିଜ୍ଞାନ (life sciences) ଏବଂ ଧାତୁ ଶିଳ୍ପ ଭଳି ଦ୍ରୁତ ଗତିରେ ବୃଦ୍ଧି ପାଉଥିବା କ୍ଷେତ୍ରଗୁଡ଼ିକରେ, ସିଷ୍ଟମ ଇଣ୍ଟିଗ୍ରେଟରଙ୍କ ସେବା ପାଇବା ପାଇଁ ପ୍ରତିଯୋଗିତା ବଢ଼ିପାରେ ଏବଂ କାମ ସମ୍ପୂର୍ଣ୍ଣ ହେବା ପାଇଁ ଅଧିକ ସମୟ (lead time) ଲାଗିପାରେ। ପ୍ରକଳ୍ପଗୁଡ଼ିକ ପାଇଁ ଆଗୁଆ ଯୋଜନା କରିବା ଦ୍ୱାରା ଆପଣ ନିଜ ପାଇଁ ସମୟ ସୁନିଶ୍ଚିତ କରିପାରିବେ।
ସିଷ୍ଟମ ଇଣ୍ଟିଗ୍ରେଟର: ପାରମ୍ପାରିକ ଅଟୋମୋବାଇଲ୍ (ଗାଡ଼ି ନିର୍ମାଣ) କ୍ଷେତ୍ର ସହିତ, ‘କୋବଟ୍’ (cobot – ମଣିଷ ସହ ମିଶି କାମ କରୁଥିବା ରୋବଟ୍) ଏବଂ ଅନ୍ୟାନ୍ୟ ଶିଳ୍ପ କ୍ଷେତ୍ରରେ ମଧ୍ୟ ଚାହିଦା ବୃଦ୍ଧି ପାଉଛି। କମ୍ ଜାଗା ନେଉଥିବା ଏବଂ ନମନୀୟ (flexible) ବ୍ୟବସ୍ଥାଗୁଡ଼ିକରେ ଦକ୍ଷତା ହାସଲ କରିବା ଦ୍ୱାରା ଆପଣ ନିଜ ଗ୍ରାହକଙ୍କ ପରିସର ବୃଦ୍ଧି କରିପାରିବେ।
ଯନ୍ତ୍ରାଂଶ ଏବଂ ରୋବଟ୍ ଯୋଗାଣକାରୀ: ଅଟୋମୋବାଇଲ୍ ଯନ୍ତ୍ରାଂଶ କ୍ରେତା ଏବଂ ଚିପ୍ (chip) ସମ୍ବନ୍ଧୀୟ ଉତ୍ପାଦନକାରୀମାନେ ବଡ଼ ପରିମାଣର ଅର୍ଡର ଦେଉଛନ୍ତି। କେବଳ ଅଟୋମୋବାଇଲ୍ OEM (ମୂଳ ଉପକରଣ ନିର୍ମାତା) ଉପରେ ନିର୍ଭର ନ କରି, ବଜାରର ପରିବର୍ତ୍ତନକୁ ଲକ୍ଷ୍ୟ ରଖିଲେ ଭବିଷ୍ୟତର ଚାହିଦା ବିଷୟରେ ଅଧିକ ସଠିକ୍ ଆକଳନ କରା ପ୍ରଥମ ଅର୍ଦ୍ଧାର୍ଦ୍ଧରେ ହ୍ରାସ ପାଇବା ପରେ ତୃତୀୟ ତ୍ରୟମାସରେ ଅଟୋମୋଟିଭ୍ OEM ଅର୍ଡର ୭.୫% ବୃଦ୍ଧି ପାଇଛି, କିନ୍ତୁ ୨୦୨୬ ର ପ୍ରଥମ ନଅ ମାସ ପର୍ଯ୍ୟନ୍ତ ଏହା ବର୍ଷ ପୂର୍ବ ସ୍ତରଠାରୁ ୧୭% ତଳେ ରହିଛି।
୨୦୨୬ ର ତୃତୀୟ ତ୍ରୟମାସରେ କେଉଁ କ୍ଷେତ୍ର ହ୍ରାସ ପାଇଛି?
ଖାଦ୍ୟ ଏବଂ ଉପଭୋକ୍ତା ସାମଗ୍ରୀ ଉଲ୍ଲେଖନୀୟ ହ୍ରାସକାରୀ ଥିଲା, ଅର୍ଡର ୨୩.୭% ହ୍ରାସ ପାଇଛି। ୨୦୨୫ ର ତୃତୀୟ ତ୍ରୟମାସରେ ଏହି କ୍ଷେତ୍ର ୧୦୫% ବୃଦ୍ଧି ପାଇଛି, ଯାହା ଏକ କଠିନ ତୁଳନାତ୍ମକ କାରଣ ହୋଇଛି।
୨୦୨୬ ର ତୃତୀୟ ତ୍ରୟମାସରେ କେତେ କୋବୋଟ୍ ଅର୍ଡର କରାଯାଇଥିଲା?
A3 ରିପୋର୍ଟ କରିଛି ଯେ ୧,୮୩୧ ସହଯୋଗୀ ରୋବୋଟ୍ ମୂଲ୍ୟ $୬୩.୮ ନିୟୁତ, ଯାହା ୨୦୨୫ ର ତୃତୀୟ ତ୍ରୟମାସ ଠାରୁ ୟୁନିଟ୍ ରେ ପ୍ରାୟ ୫୬% ଅଧିକ। ସେମାନେ ଏହି ତ୍ରୟମାସରେ ଅର୍ଡର କରାଯାଇଥିବା ସମସ୍ତ ରୋବୋଟ୍ ୟୁନିଟ୍ର ୧୬.୭%।
ଅଧିକ ରୋବୋଟ୍ ଅର୍ଡର ଅର୍ଥ କ’ଣ ଅଧିକ ରୋବୋଟ୍ ପୂର୍ବରୁ ସଂସ୍ଥାପିତ ହୋଇଛି?
ଜରୁରୀ ନୁହେଁ। ଅର୍ଡରଗୁଡ଼ିକ କ୍ରୟ ପ୍ରତିଶ୍ରୁତି ମାପ କରନ୍ତି, ସମ୍ପୂର୍ଣ୍ଣ ସଂସ୍ଥାପନ ନୁହେଁ। ବିତରଣ ଏବଂ ନିୟୋଜନ ସାଧାରଣତଃ ଅର୍ଡର ଦେବା ପରେ ଅନୁସରଣ କରାଯାଏ, ତେଣୁ ଅର୍ଡରଗୁଡ଼ିକୁ ଏକ ପ୍ରମୁଖ ସୂଚକ ଭାବରେ ପଢ଼ାଯାଏ।
A3 କ’ଣ?
A3, ଆଡଭାନ୍ସିଂ ଅଟୋମେସନ ଆସୋସିଏସନ୍, ଏକ ବାଣିଜ୍ୟ ସଂଘ ଯାହା ଅଟୋମେସନ ପ୍ରଯୁକ୍ତିବିଦ୍ୟାକୁ ପ୍ରୋତ୍ସାହିତ କରେ ଏବଂ ତ୍ରୈମାସିକ ପ୍ରକାଶନ କରେ ଉତ୍ତର ଆମେରିକୀୟ ରୋବୋଟ୍ ଅର୍ଡର ତଥ୍ୟ। ଏହା କହିଛି ଯେ ଏହାର ସଦସ୍ୟମାନଙ୍କ ମଧ୍ୟରେ 1,500 ରୁ ଅଧିକ ନିର୍ମାତା, ଉପାଦାନ ଯୋଗାଣକାରୀ, ସିଷ୍ଟମ ଇଣ୍ଟିଗ୍ରେଟର, ଶେଷ ଉପଭୋକ୍ତା, ଶିକ୍ଷାନୁଷ୍ଠାନ, ଗବେଷଣା ଗୋଷ୍ଠୀ ଏବଂ ପରାମର୍ଶଦାତା ସଂସ୍ଥା ଅନ୍ତର୍ଭୁକ୍ତ।
ମୂଳ କଥା
2026 3 ତ୍ରୟମାସରେ ଉତ୍ତର ଆମେରିକୀୟ ରୋବୋଟ୍ ଅର୍ଡର 24.8% ବୃଦ୍ଧି ପାଇଛି, ଏବଂ ବିବରଣୀ ଶିରୋନାମା ପରି ଉତ୍ସାହଜନକ। ଅଭିବୃଦ୍ଧି ଅଟୋମୋଟିଭ୍ ଯୋଗାଣକାରୀ, ଚିପ୍ ଏବଂ ଇଲେକ୍ଟ୍ରୋନିକ୍ସ ନିର୍ମାତା, ଜୀବନ ବିଜ୍ଞାନ, ଧାତୁ ଏବଂ ପ୍ଲାଷ୍ଟିକ୍ ରୁ ଆସିଥିଲା, ଯେତେବେଳେ ଅଟୋମୋଟିଭ୍ OEM ଶେଷରେ ସକାରାତ୍ମକ କ୍ଷେତ୍ରରେ ଫେରି ଆସିଥିଲା। କୋବୋଟ୍ସ ଗତି ଉଠାଇଥିଲେ, ଏବଂ ଉତ୍ପାଦନ କାର୍ଯ୍ୟକଳାପ ଲଗାତାର ନବମ ମାସ ପାଇଁ ବିସ୍ତାରରେ ରହିଲା।
ସତର୍କତା ବାସ୍ତବ। ଅଟୋମୋଟିଭ୍ OEM ଅର୍ଡର ବର୍ଷ ପାଇଁ ଏବେ ବି ହ୍ରାସ ପାଇଛି, ଖାଦ୍ୟ ଏବଂ ଉପଭୋକ୍ତା ସାମଗ୍ରୀ ପଛକୁ ଟାଣି ନିଆଯାଇଛି, ଏବଂ ଇନପୁଟ୍ ଖର୍ଚ୍ଚ ଏବଂ ବାଣିଜ୍ୟ ଅନିଶ୍ଚିତତା ଯୋଜନାଗୁଡ଼ିକୁ ପରିବର୍ତ୍ତନ କରିପାରେ। କିନ୍ତୁ ସେପ୍ଟେମ୍ବର ପର୍ଯ୍ୟନ୍ତ 28,984 ରୋବୋଟ୍ ଅର୍ଡର ସହିତ, ବଜାର Q4 ରେ ଗତି ପାଇଛି। ପରବର୍ତ୍ତୀ A3 ରୋବୋଟ୍ ଅର୍ଡର ରିପୋର୍ଟ ଦେଖାଇବ ଯେ ତୃତୀୟ ତ୍ରୟମାସ ଏକ ବ୍ରେକଆଉଟ୍ ଥିଲା କି ଏକ ଉଚ୍ଚ-ଜଳ ଚିହ୍ନ ଥିଲା।